


 Giveaway")
 Giveaway")


After deciding the type and style of investing you would like to pursue, what’s next? Chartered Financial Consultant Winston Tan talks about three key things to look out for.
There are largely 3 types of indicators: leading, coincident and lagging. These indicators are part of macroeconomic statistics and are often used by economists and investors to help them “forecast” the direction and understand the current health of an economy.

1. Leading Indicators
There are a few leading indicators available to consumers (some economic data are only available through monthly subscriptions): Market Indexes, Bond Interest Rates, Foreign Exchange Rates, Commodity Prices, Employment Rate, Money Supply, Purchasing Managers Index (PMI), Consumer Confidence Index, just to name a few of the major indicators.
All these indicators are forward looking as they project how the economy will perform in future. Do note that some indicators can only project to the next week or month. Very few indicators in the current volatile economic climate are able to project accurately more than a few months ahead.
I will now touch on a few key leading indicators.
- Market Indexes
Stock and futures indexes are made up of a basket of companies that operates within that country, reflecting the company’s current and future share price.
Current share price are in turn, dependent on the future expected earnings of a company, e.g. Apple announces they will earn $X in the coming quarter or year. This explains why when a company announces a less than expected quarter or yearly earnings, the share price of that company drops, which in turn affects the stock and futures indexes.
- Employment Rate
Employment rate is indicative of where the economy is heading. With an upward trend of employment rate, it is usually indicative of an expanding economy (more domestic spending and improving Gross Domestic Product).
- Money Supply

Money supply indicators (M1, M2 and M3) are a calculation of how much monies are within a country’s economy. An upward trend is indicative of inflation. In our digital world, money flows are now so quick that these indicators may not be as useful as they were in the past.
- Purchasing Managers Index (PMI)
PMI is a monthly survey of purchasing managers across the different economies in the world. The survey collects data from managers, whom have to answer the survey with answers “Better”, “Same” or ‘Worse’. The data collected will be compiled into an index.
An index of 50 means the economy is the “Same” as the previous month. A reading above 50 indicates an expanding economy. A reading below 50 means a contracting economy.
This index is now widely considered as an important leading indicator due to its reliability in predicting an economy’s growth, i.e. Gross Domestic Product, which is a lagging indicator.
2. Coincident Indicators
Coincident indicators are indicators which tell us where an economy is as at now. These indicators include Producer Price Index (PPI), Consumers Price Index (CPI), Retail Sales Report, and Personal Savings rates to name a few.
- Consumers Price Index (CPI)
CPI is a monthly index that tracks price changes of a basket of goods that were purchased at a consumer retail level, e.g. price of food, price of public transport. This index is normally equated with the rate of inflation, which is not entirely correct, as the CPI is constricted to only a range of goods, which may not correctly capture the overall price increases of goods in the economy. Also, the inflation indicator may be seen as either an increase in prices or an increase in money supply or both.
3. Lagging Indicators
Lagging indicators are indicators telling us where an economy was in the past. These indicators include Gross Domestic Product, Productivity Report, Simple/Exponential Moving Averages (technical indicator for stock markets), to name a few.
- Gross Domestic Product (GDP)
GDP is a lagging indicator that shows how much an economy had produced in the past one year, much like an annual report of a company, showing the revenues and expenses of an economy/country. This indicator is typically tracked for a few years, to see if the GDP is on an increasing or decreasing trend. E.g. Singapore’s GDP had grown 6.1% in 2011, 2.5% in 2012 and 3.9% in 2013.
GDP growth and inflation rates typically go hand in hand. With an expanding economy, inflation will most likely happen. The trick of keeping inflation to a minimum is a fine balance. Inflation is likened to be a necessary evil for GDP growth.
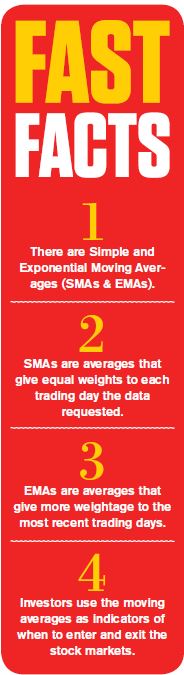
- Simple/Exponential Moving Averages (SMAs, EMAs)
SMAs and EMAs are tools that track the performance of the stock market over a period of time. E.g. one can track a 50-day Moving Average of Singapore Straits Time Index. These simple tools are readily available on the internet. Please do contact me directly for a link to these tools.
These averages track whether the current stock market is trading below or above the moving averages.
Is There A Best Indicator?
My clients like to ask me, “Winston, there are so many indicators, it is very hard for me to follow each and every one. Is there one indicator which is the most important and accurate of all?” Unfortunately, I always have to burst their bubble by telling them there is no indicator that is the best indicator. There are reasons why leading, coincident and lagging indicators are still around. All these indicators should be viewed from a macro view to make sense of all the numbers.
By Winston Tan
For queries, email Winston at tanooisim_winston@hotmail.com.
This article was first published in The New Age Parents e-magazine
How To Invest And Grow Your Money Series:
Part 1: Important Things To Consider
Part 2: Investment Basics 101
Part 3: Different Investment Styles
Part 5: Important Facts To Know Before Investing
If you find this article useful, do click Like and Share at the bottom of the post, thank you.
Want more comprehensive info? Check out our e-guides here.


")


Leave a Comment: